Understanding Opera Cloud Identity Management (OCIM) in Practical Terms
May 9, 2026Understanding Opera Cloud R&A Data Access and Security in Simple Practical Terms
May 18, 2026Opera Cloud Reporting & Analytics (R&A) is Oracle’s centralized cloud reporting platform for hotels. It replaces traditional Opera v5 static reports with interactive dashboards, subject areas, datasets, and visual analytics. New users often feel lost at first but this is normal. The biggest mindset shift is moving from SQL-driven reports to browser-based, visual, cloud analytics. Start with Subject Areas and existing dashboards, then build from there.
When many Opera v5 users first enter Opera Cloud Reporting & Analytics (R&A), the first reaction is usually something like:
“I opened it… but I honestly don’t know what I’m looking at.”
Instead of traditional reports, users suddenly see:
- Dashboards
- Subject Areas
- Datasets
- Visualizations
- Analytics folders
For many long-time Opera users, especially those coming from Oracle Reports Builder or Opera standard reports, R&A initially feels completely different.
And honestly, that feeling is normal. In this article, I want to explain Opera Cloud Reporting & Analytics (R&A) in simple and practical terms based on how many hotel users, IT teams, and consultants experience it for the first time.
What Is Opera Cloud Reporting & Analytics (R&A)?
Put simply: R&A is Opera Cloud’s centralized reporting and analytics platform. But it is important to understand one thing:
R&A is not just a “report printing system.”
It is designed to provide:
- Operational reporting
- Dashboards
- Analytics
- Visual data analysis
- Cross-property visibility
- Business insights
all from a centralized cloud platform.
Why R&A Feels Different from Opera v5
The differences when moving from Opera v5 to Cloud people initially feel confused. In Opera v5 environments, many of us were used to:
- Opera Simple Reports or OSR
- Oracle Reports Builder
- File Exports
- SQL-driven reports
- Static printed reports
- Direct database reporting logic
The mindset was usually:
“Write SQL → generate report → print/export.” (When you cannot do it in OSR)
Opera v5 Reports vs Opera Cloud R&A — Key Differences
| Feature | Opera v5 Reports | Opera Cloud R&A |
|---|---|---|
| Report Type | Static, printed reports | Interactive dashboards & visuals |
| Technology | Oracle Reports Builder / OSR | Cloud-based analytics platform |
| Data Access | Direct SQL / database queries | Subject Areas (pre-built data sets) |
| Access | Local / on-premises only | Browser-based, anywhere access |
| Multi-Property | Limited / complex setup | Built-in cross-property reporting |
| Visualisation | Text-based, tabular output | Charts, graphs, pivot tables, KPIs |
| Target Users | IT teams & report writers | All departments & management |
| Customisation | RDF files / SQL scripting | Drag-and-drop report builder |
| Real-Time Data | Snapshot at time of running | Near real-time operational data |
| Learning Curve | Familiar to long-time Opera users | New mindset required — but more powerful |
R&A introduces a different approach. Instead of only static reports, Opera Cloud focuses more on:
- Interactive dashboards
- Visual analytics
- Prepared business data structures
- Cloud-based reporting access
At first, this feels unfamiliar, especially for consultants who spent years working directly with SQL queries and RDF reports, including us at the beginning.
But once the structure is understood, the platform starts making much more sense.
Why Oracle Moved Toward R&A
Opera Cloud is designed as a centralized cloud platform. Because of this, Oracle needed reporting that could:
- Work across multiple properties
- Support browser-based access
- Handle analytics visually
- Provide real-time operational insights
- Reduce dependency on local reporting infrastructure
This is where R&A comes in.
Instead of each hotel managing large numbers of local report files, R&A provides a more centralized and scalable reporting environment.
Understanding the Main Components of R&A
This is where many beginners feel overwhelmed initially. Let me explain these components in practical terms.
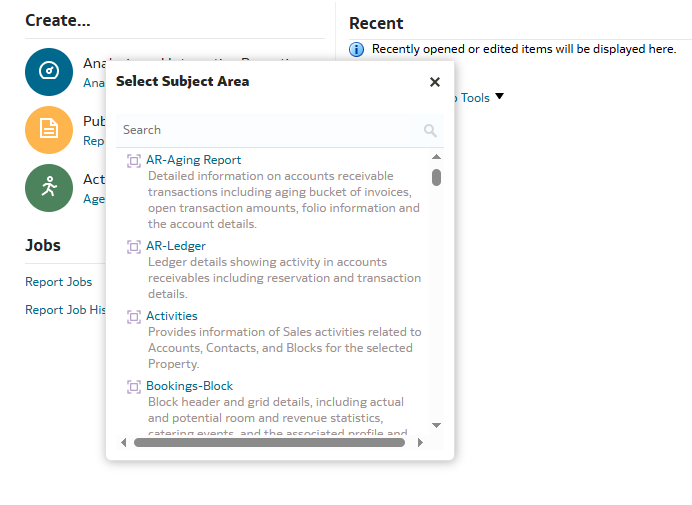
Subject Areas – The Foundation of R&A
One of the first terms users encounter is: Subject Areas. At first, the name itself can feel confusing but in simple terms, a Subject Area is a prepared business data category.
Examples might include:
- Reservations
- Revenue
- Housekeeping
- Financials
- Profiles
- Forecasting
Think of Subject Areas as: “Organized business data made available for reporting.”
Instead of directly querying database tables like in v5, R&A presents prepared business-friendly data structures. This is one of the biggest mindset shifts for Opera v5 report writers.
Reports – Individual Reporting Objects
Reports are the individual analysis objects created using Subject Areas.
These may include:
- Tables
- Charts
- KPI summaries
- Data grids
In simple terms: Reports are the individual pieces of information that users create and analyze.
Dashboards – Combining Multiple Reports Together
Dashboards are one of the most visible parts of R&A. A Dashboard combines multiple reports into a single screen.
For example:
A Front Office Dashboard may contain:
- Arrivals today
- Occupancy statistics
- VIP arrivals
- Room status summary
- Revenue KPIs
This allows management teams to view operational information quickly without running multiple separate reports.
Datasets – Custom Prepared Data Collections
Datasets are another area that often creates confusion.
Put simply: A Dataset is a custom collection of prepared data ready to be used for reporting or visualization.
Datasets become useful when:
- Standard Subject Areas are not enough
- Custom reporting requirements exist
- Advanced analysis is needed
For many beginners, it is completely normal not to fully understand Datasets immediately. Even experienced consultants usually become comfortable with this area gradually while working with real reporting requirements.
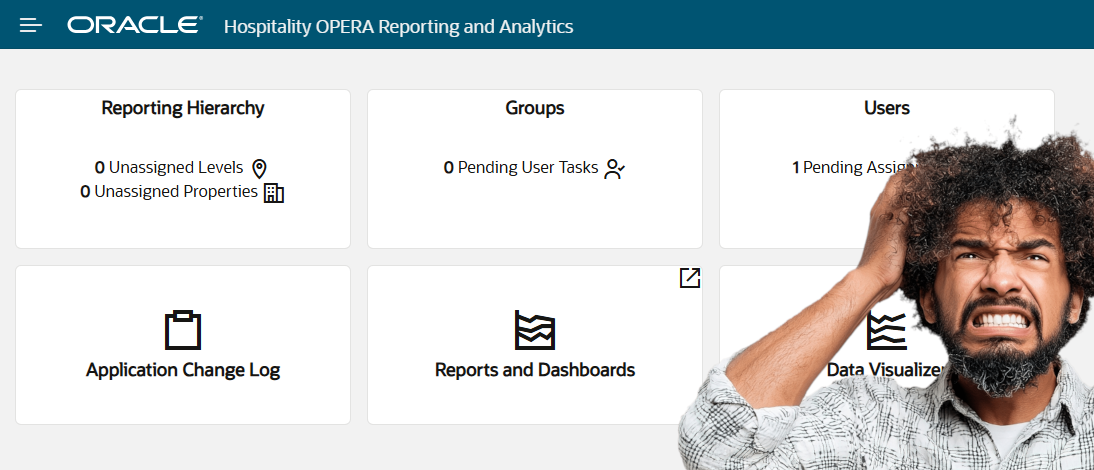
Why Many Users Initially Feel Lost in R&A
This is very common. A user logs into R&A and sees:
- Empty dashboards
- Missing Subject Areas
- Different folders
- Limited access
Immediately they think: “Something is wrong.” But in many cases, the issue is simply:
- Security roles
- Access assignments
- Group permissions
- Property visibility settings
This is why R&A is closely connected with Opera Cloud Identity Management (OCIM). Sometimes the issue is not the report itself – it might be a user access configuration.
R&A Is Not Just for IT Teams
This is another important point. Many people initially assume R&A is only for:
- IT departments
- Analysts
- Technical users
But in reality, R&A is designed for operational users as well.
Examples:
- Front Office managers
- Revenue teams
- Housekeeping managers
- Finance teams
- Regional operations teams
Different departments can use dashboards and reports relevant to their operations.
Opera Cloud R&A by Hotel Department
R&A is not just for IT teams. Here is how different hotel departments use Opera Cloud Reporting & Analytics in their daily operations.
📊 Opera Cloud R&A for Revenue Managers
Revenue Managers use R&A to monitor occupancy trends, ADR performance, forecast comparisons, and revenue pickup – all from a single dashboard. Instead of running multiple static reports manually, R&A presents this information visually in real time, enabling faster and more confident pricing decisions.
🏨 Opera Cloud R&A for Front Office Managers
Front Office Managers use R&A dashboards to track arrivals, departures, VIP guests, room status, and occupancy statistics for the day. The Property Overview dashboard provides a real-time snapshot of key operational metrics without needing to run individual reports.
🛏️ Opera Cloud R&A for Housekeeping Managers
Housekeeping Managers use R&A to monitor room status across the property – including clean, dirty, inspected, and out-of-order rooms. Real-time visibility helps identify demand variances quickly and coordinate room readiness more efficiently during peak arrival periods.
💰 Opera Cloud R&A for Finance Teams
Finance Teams use R&A to access the Financials dashboard, which provides visualisations of revenue by market segment, payment summaries, and ledger activity details. This replaces the need for manual financial report extraction and provides a centralised view of property financial performance.
🏢 Opera Cloud R&A for General Managers
General Managers use R&A for cross-property visibility and high-level performance monitoring. The platform allows GMs to compare performance across multiple properties simultaneously, review year-over-year trends, and make faster operational decisions based on real-time business data.
Real-World Practical Example
Let’s take a simple example, a Revenue Manager may want to see:
- Occupancy trends
- ADR performance
- Forecast comparisons
- Revenue pickup
Instead of running multiple static reports manually, R&A dashboards can present this information visually on a single screen.
This is one of the biggest operational advantages of modern analytics platforms.
Why R&A Is Important in Opera Cloud
As hotels move further into cloud-based operations, reporting expectations also change.
Hotels now expect:
- Real-time visibility
- Browser-based access
- Centralized analytics
- Cross-property reporting
- Faster operational decisions
R&A is Oracle’s answer to these modern reporting requirements.
The Biggest Mindset Shift from v5
This is probably the most important point in the entire article.
In Opera v5:
- Many reports were database-driven – Example, tracking ADR and revenue by travel agent in OPERA
- SQL-focused
- Static in nature (every time you run the report, data changes but not the structure of the report)
In R&A:
- Reporting becomes more business-oriented, for example, how revenue management decisions use PMS data
- More visual
- More centralized
- More interactive
At first, this feels very different but once users understand:
- Subject Areas
- Dashboards
- Reports
- Datasets
the platform starts becoming much easier to navigate.
Final Thoughts
When first entering Opera Cloud Reporting & Analytics, it is completely normal to feel confused.
Especially for long-time Opera PMS users, R&A introduces a very different reporting mindset and it’s a transition, including myself.
But once the structure is understood in practical terms, things become much clearer.
From my experience, the key is: Don’t try to understand everything at once.
Start with:
- Subject Areas
- Simple reports
- Existing dashboards
- Basic navigation
Then gradually move deeper into analytics and visualization capabilities.
Over time, R&A becomes not just a reporting tool, but a very powerful operational visibility platform within Opera Cloud.
FAQ
What is Opera Cloud Reporting and Analytics (R&A)?
Opera Cloud Reporting and Analytics (R&A) is Oracle’s centralized cloud-based reporting platform for hotels. Unlike traditional Opera v5 reports, R&A provides interactive dashboards, subject areas, datasets, and visual analytics — all accessible from a browser without local report files.
What are Subject Areas in Opera Cloud R&A?
Subject Areas are pre-built business data categories inside Opera Cloud R&A. Examples include Reservations, Revenue, Housekeeping, and Financials. Instead of writing SQL queries like in Opera v5, users access these structured data sets to build reports and dashboards.
What is the difference between Opera Cloud R&A and Opera v5 reports?
Opera v5 reporting was SQL-driven and static — users ran reports and printed or exported them. Opera Cloud R&A is interactive and visual, using dashboards, subject areas, and datasets. It is designed for cloud-based access across multiple properties, replacing tools like Oracle Reports Builder and Opera Simple Reports (OSR)
Why can’t I see Subject Areas in Opera Cloud R&A?
Missing Subject Areas in R&A is almost always a security or access issue, not a technical fault. R&A access is controlled through OCIM (Opera Cloud Identity Management) and RNAACCESS group assignments. If Subject Areas are missing or dashboards appear empty, the user’s role or group permissions may not be configured correctly.
Is Opera Cloud R&A only for IT teams?
No. Opera Cloud R&A is designed for all hotel departments, including Front Office managers, Revenue teams, Housekeeping, and Finance. Different users can access dashboards and reports relevant to their specific role and operations.
What dashboards come with Opera Cloud Reporting and Analytics?
Opera Cloud R&A includes standard dashboards such as Property Overview, Financials, and Reservations. Each dashboard combines multiple reports on one screen, showing KPIs like room revenue, occupancy, ADR, arrival and departure counts, and financial summaries.
How do beginners start learning Opera Cloud R&A?
Beginners should start with Subject Areas and existing dashboards before building custom reports. The key mindset shift is moving away from SQL-driven static reports toward interactive, visual, cloud-based analytics. Start with navigation and basic dashboard access before moving into datasets and advanced visualizations.
References
Written by Mohamed, e360 Hospitality Solutions, Oracle Opera PMS Consultant with 20+ years experience. In future articles, I will also cover:
- Subject Areas
- Dashboards
- R&A security and access
- Building reports
- Practical reporting scenarios in Opera Cloud